EV Charging Reliability: Status Lights Lie
EV charging reliability data shows 99% uptime claims mask a 71% first-charge success rate. Here is what that gap means for operations leaders.
AUTHOR

Ralf Klein
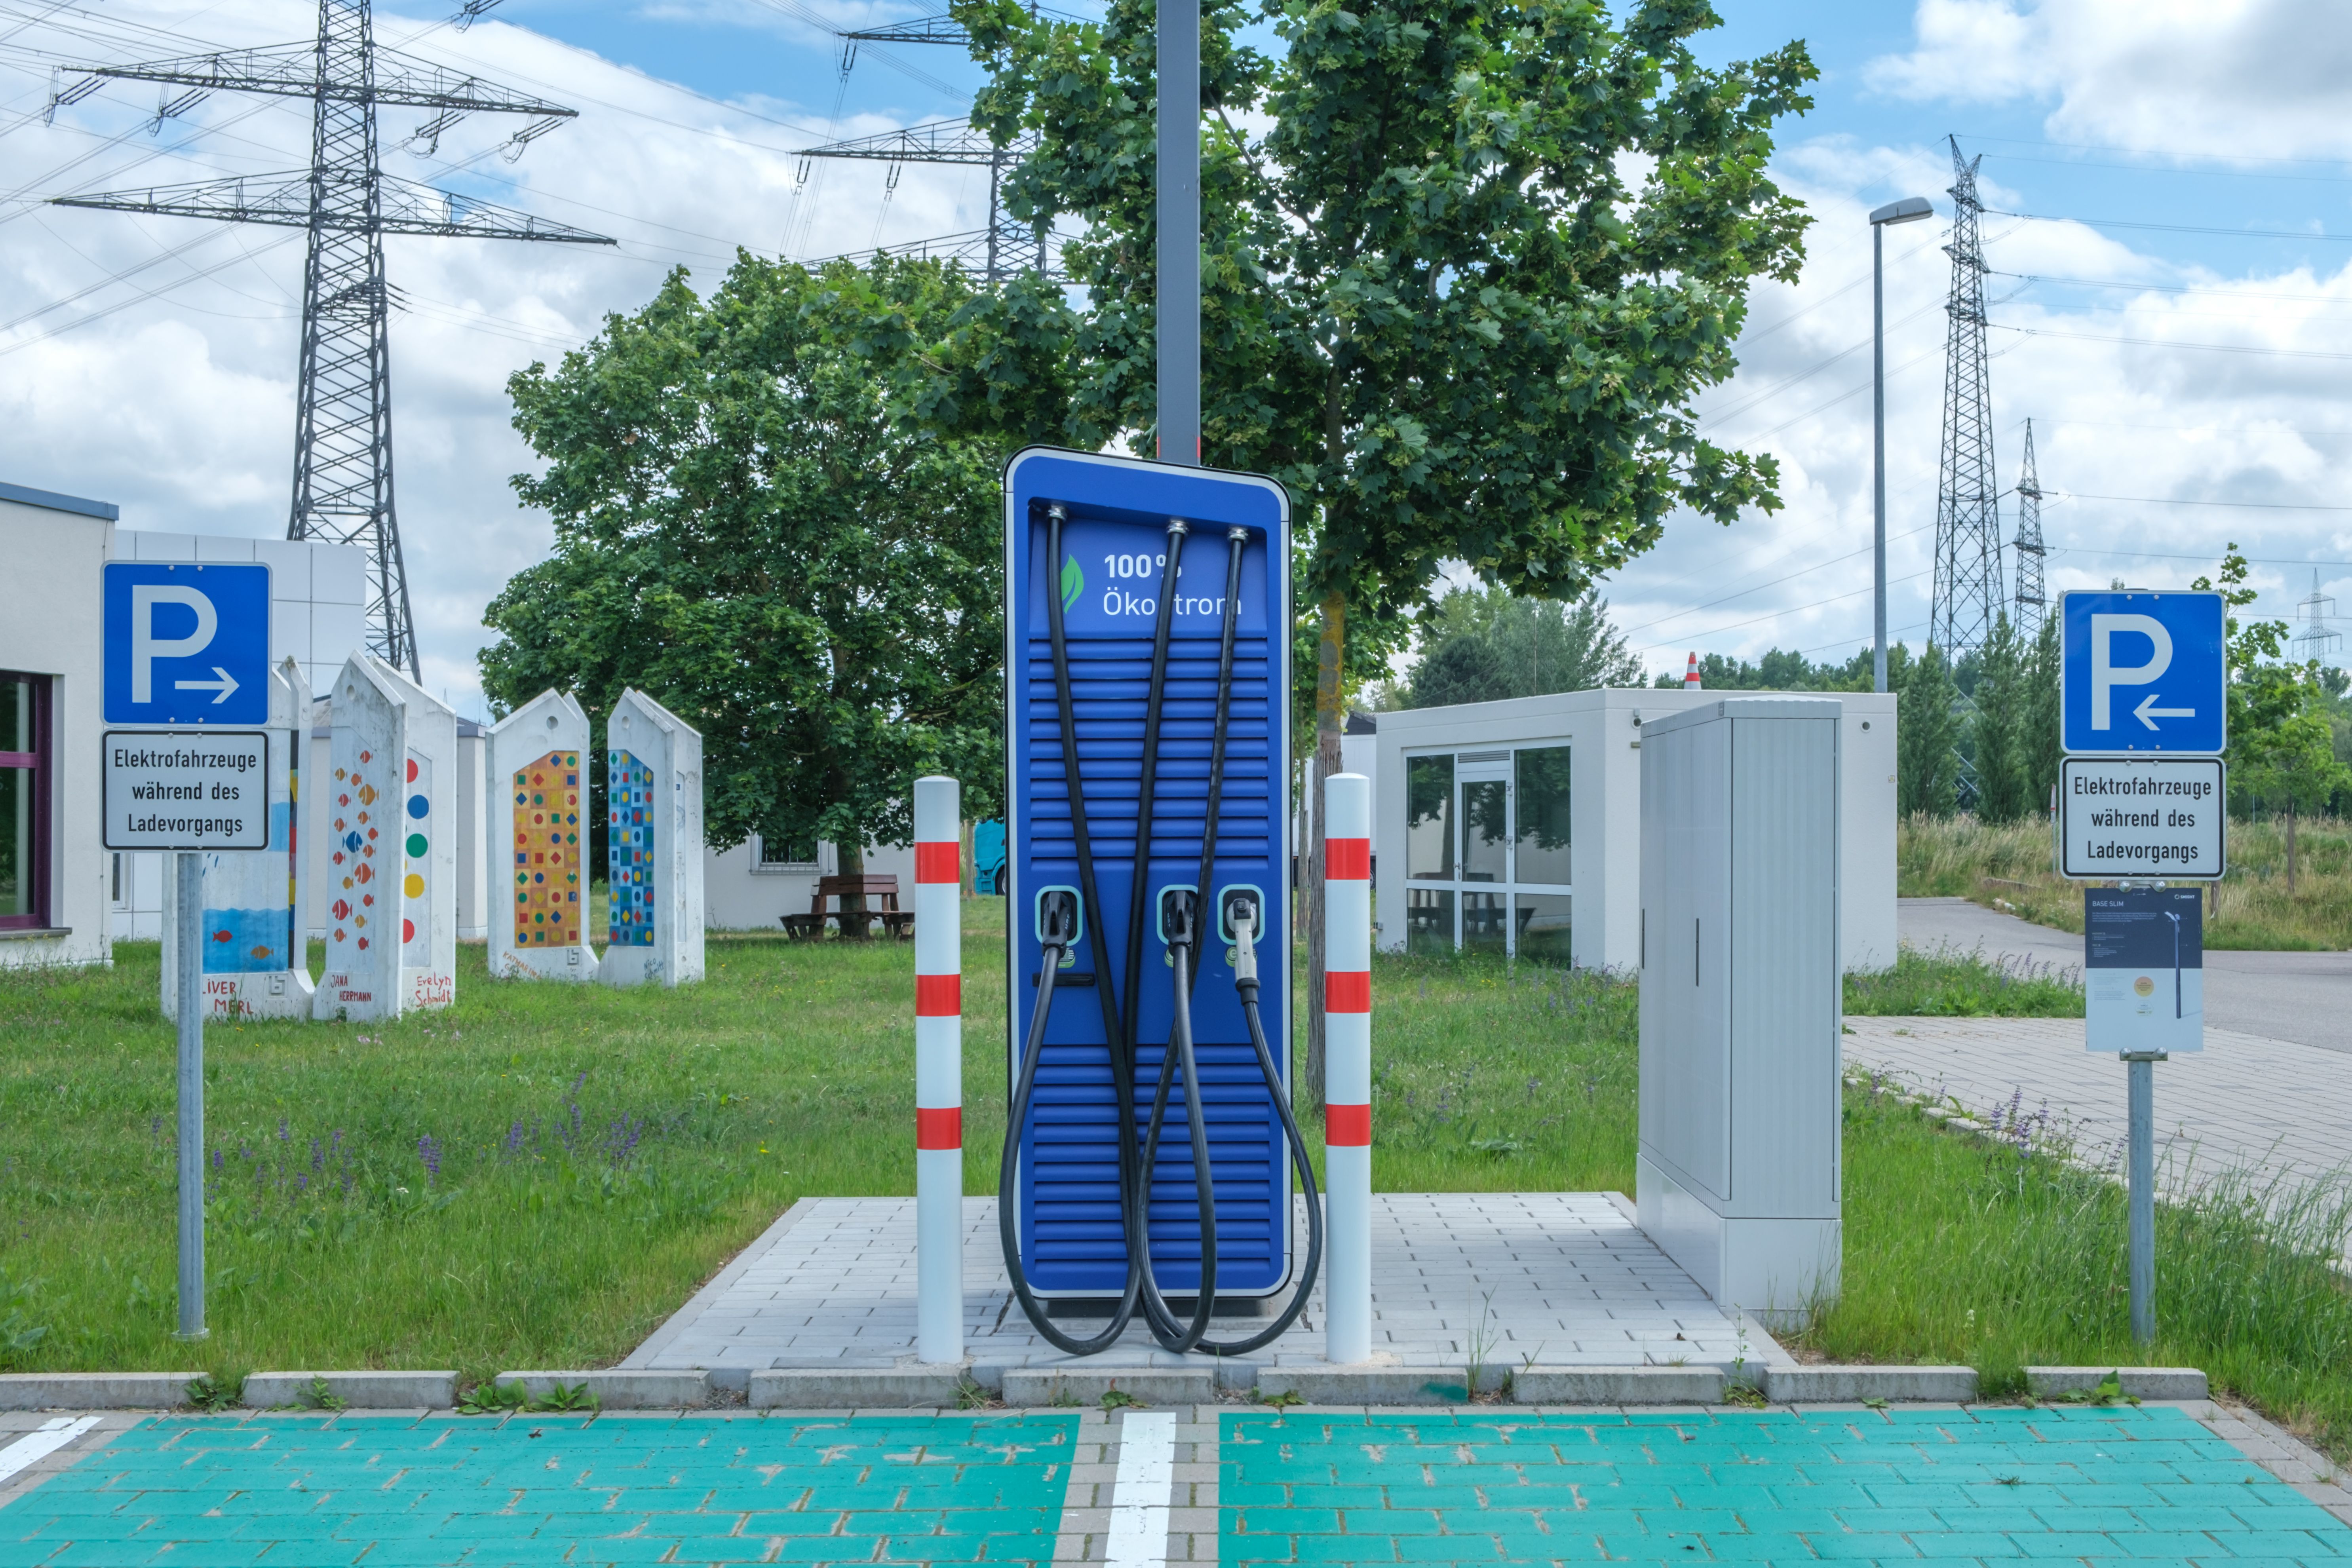
Nearly one in five attempts to use a public EV charger fails, even as networks report uptime figures between 98.7% and 99.9%. That figure comes from the World Economic Forum's 2024 EV charging policy roadmap, and it is the clearest available proof that a green status light and a completed session are two different things.
The UK government has responded by mandating a minimum 99% reliability standard for public chargers. The standard is defined as the percentage of time a charger is reported as available to use. Fewer than 4% of operators currently meet it. The gap between the reported metric and the lived outcome is not a rounding error. It is a structural problem in how operations are measured, and it shows up in every ticket-heavy environment that confuses activity with resolution.
EV Charging Reliability Numbers and What They Actually Measure
When a charging network reports 99% uptime, it is almost always measuring whether the unit is powered on and reachable by the network. It is not measuring whether a driver plugged in a cable and left with a charged vehicle. The 2026 session data showing a 71% first-charge success rate makes that distinction concrete. Roughly three in ten drivers who pulled up to an available charger could not complete their first attempt.
The failure mix breaks down as follows: connector and cable faults account for around 28% of failures, network and software faults for around 25%, and power electronics for around 22%. None of these failure types necessarily trips a status flag. A charger with a damaged connector cable can sit on a dashboard as green and available until a driver physically discovers the problem. At that point the metric has already been recorded as uptime. The failure only enters the data when someone files a report, and in many networks that report never becomes a tracked, actioned ticket.
This is not a problem unique to EV infrastructure. Any operation that measures process state rather than outcome delivery carries the same blind spot. A maintenance ticket marked resolved that did not fix the underlying fault, a support case closed after a first response with no confirmed resolution, a property inspection logged as complete when the unit was never entered: these are the same failure mode expressed in different sectors.
The Maintenance Gap Behind the Uptime Claim
The operators who are closing the reliability gap share one operational habit: they treat every fault as a tracked, actioned event rather than a dashboard color to be cleared. Over 40% of faults in leading networks are resolved remotely through second-line diagnostics, which means a technician never needs to roll a vehicle to the site. That resolution rate is only possible when the fault data is granular enough to distinguish a firmware issue from a hardware failure before anyone is dispatched.
Predictive maintenance programs take this further. McKinsey's operations research on manufacturing analytics reports that predictive maintenance typically reduces machine downtime by 30 to 50% and extends machine life by 20 to 40%. The mechanism is the same whether the asset is a CNC machine or a DC fast charger: structured fault tracking surfaces patterns before they become failures, and proactive intervention replaces reactive dispatch.
One energy operator that implemented advanced maintenance analytics and remote diagnostics across a high-performing asset fleet achieved a 20% average reduction in downtime, according to McKinsey's work on digitizing maintenance and reliability. The production gains in that case were measured in hundreds of thousands of barrels of oil annually. The unit of measurement changes by sector. The operational logic does not.
For EV networks specifically, the published figure for predictive maintenance reducing equipment failures is as high as 73%, cited in field deployments where fault data feeds directly into intervention scheduling rather than sitting in a log. The difference between a network hitting 71% session success and one hitting 95% is almost entirely in the quality of the fault-to-ticket-to-resolution pipeline, not in the hardware specification of the chargers themselves.
Why the Property and Facilities Parallel Is Exact
Property and facility operations leaders often read EV charging data as a sector-specific problem. It is not. The structural failure is identical to what happens in any asset-heavy environment where the metric reported to leadership is a status flag rather than a confirmed outcome.
Consider a residential property portfolio with several hundred maintenance tickets open at any given time. The dashboard shows 92% of tickets closed within the SLA window. What it does not show is the percentage of those closed tickets where the reported fault was actually fixed on the first visit, the percentage where the resident confirmed resolution, or the percentage that reopened within 30 days because the underlying cause was never addressed. Those are outcome metrics. The SLA closure rate is a process metric. Confusing the two produces the same 71% session success rate problem, expressed as resident satisfaction scores and repeat call volume instead of failed charging attempts.
The operational lesson from EV charging reliability data is that the metric you report to leadership shapes the behavior of every team below it. If the metric is uptime, teams optimize for uptime. If the metric is completed sessions, teams optimize for completed sessions. The two are not the same, and the gap between them is where operational value leaks out.
What Closing the Gap Requires in Practice
The operators achieving the highest first-session success rates in EV networks are doing four things that translate directly to property and facility operations.
First, they measure outcomes, not states. The reported metric is completed sessions per charger per day, not percentage of time the unit is flagged available. In property terms, this is first-time fix rate and confirmed resident resolution, not ticket closure rate.
Second, every fault becomes a ticket with a fault code, not a note in a log. The 28% of EV failures attributable to connector and cable faults were only identifiable as a category because someone tracked fault type at the point of report. Without that structure, the data is noise.
Third, remote diagnostics are the first response, not the last resort. Sending a technician to site before running a remote diagnostic is the equivalent of dispatching a maintenance contractor before checking whether the issue is a tripped circuit breaker. McKinsey's repair analytics research consistently shows that structured remote triage reduces unnecessary site visits and improves first-time fix rates across field service operations.
Fourth, the fault data feeds forward into scheduling. Predictive maintenance only works when historical fault patterns are visible and connected to intervention planning. A charger that has had two connector faults in six months is a candidate for proactive replacement before the third fault. A property unit that has had three plumbing tickets in twelve months is a candidate for a full inspection before the fourth call.
None of this requires new hardware or new software platforms. It requires a decision about what to measure and a process that makes every fault visible, categorized, and actioned.
The EV charging sector is a useful case because the failure is visible in real time to real people standing in a car park in the rain. The charger says available. The session will not start. The gap between the metric and the outcome is impossible to ignore. In property operations, the same gap is easier to hide behind a closed ticket. The resident who gave up calling is not in the data. The fault that recurred three months later is logged as a new ticket, not a repeat. The dashboard stays green.
Measure the Session, Not the Light
The UK's 99% uptime mandate for EV chargers is a useful policy instrument, but fewer than 4% of operators meet it precisely because the mandate measures reported availability rather than delivered sessions. A charger can be available and broken at the same time. A ticket can be closed and unresolved at the same time.
The operations leaders who close this gap are not doing anything exotic. They are measuring what actually happened, tracking every fault with enough structure to act on it, and using that data to intervene before the next failure rather than after it. That is the operational standard the EV charging reliability data is pointing toward, and it applies to every queue, every asset, and every team that reports a status rather than an outcome.
BLOG
Other insights
 InsightsApr 17, 2026Bloxs and AI: Why Tenant Communication Is the Biggest Untapped Win in Property ManagementHow Bloxs users are combining AI to automate tenant communication, and what the data shows about adoption rates, ROI, and what actually works.
 InsightsApr 13, 2026Anthropic Built an AI That Found 3,000 Zero-Day Vulnerabilities. Then They Refused to Release It.Claude Mythos scores 93.9% on SWE-bench and found 3,000+ zero-days including a 27-year-old OpenBSD bug. Anthropic won't release it publicly.
 InsightsApr 10, 202672% of Tenants Leave Over Response Time, Not the Repair ItselfAI responds to maintenance tickets in 3 minutes. Property managers take days. Data shows this response gap drives 72% of tenant non-renewals.